


A dinner game
Gather round, children. I have a sad fable to tell.
Five friends have been invited to dinner. They all sit down to eat.
But something seems off.
One person has only been served a quarter of a meal. One has a full meal. The person in the next chair gets just over two meals, and next after that gets three.
And the lucky person seated at the head of the table has over three and a half meals to enjoy.
It seems absurd. Who could even eat three and a half meals at one sitting? Why wouldn’t they save it for later?
And it is absurd.
We have told a story about a dinner – a form of consumption.
The differences in portion sizes come from inequalities in New Zealand’s net worth statistics, rather than inequalities in consumption.
And I neglected to mention something important about my guests.
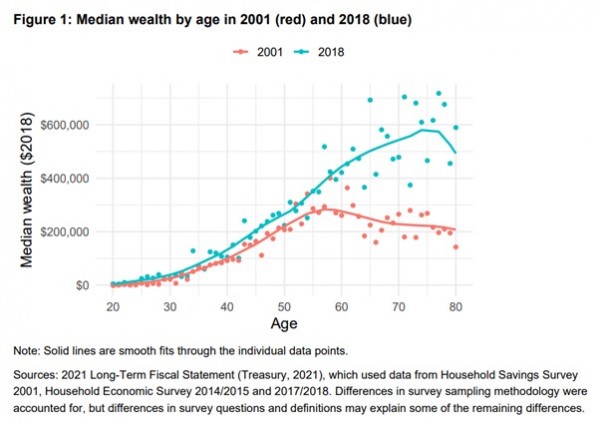
One of them is aged 30, one 40, one 50, one 60, and one is 70.
Each of them has the median net worth of people in their age group. And yet one has only a quarter of a meal, and another has three and a half meals.
If a time machine let you dine with yourself at different ages, there would be a lot of inequality in net worth around that table. But it hardly seems the kind of thing that the tax system should worry about.
Last week, Stuff started syndicating illustrations by The Spinoff’s Toby Morris. Morris illustrated inequality in net worth with a similar dinner table analogy. Some received more meals than they could possibly eat. Others went hungry.
But simple age differences in net worth as people start their careers, gain experience, and shift to retirement generated the unequal portions at my dinner table, all on their own. Neglecting to tell you that my guests varied in age, and that age differences matter, could almost be called misinformation.
There are further problems.
A student’s debt will count as negative net worth. Higher future earnings that pay for today’s student’s meals take a long time to show up in net worth tables.
New Zealand’s pension system also means differences in wealth are overstated.
Individual retirement accounts like Kiwisaver show up in measured net worth. NZ Super does not.
If the government replaced NZ Super with individual retirement accounts providing exactly as much retirement income, measured inequality in net worth could drop considerably. It would be like adding about $200,000 to an individual’s Kiwisaver fund at age 65.
Source: Luke Symes, 2021. “The Wealth Ladder: House Prices and Wealth Inequality”. Treasury.
Morris points to recent wealth increases among the ten richest New Zealanders. But the Statistics New Zealand tables show a slight decline in inequality from 2018 to 2021.
Proportions of net worth held by each of the top 1%, the top 5%, the top 10%, and the top 50%, both for individuals and for households, were lower in 2021 than in 2018.
The Gini index is one way of measuring inequality. The Gini measure of inequality in net worth, for individuals, dropped from 76.7 to 75.8; for households, it dropped from 69.1 to 67.8.
So the illustrated version overstates differences in net worth, ignores that much inequality in net worth simply comes down to age differences across people, and misrepresents whether inequality has been increasing or decreasing overall.
Why does this matter? Differences in consumption at the dinner table are implicit demands that something be done to reduce those differences.
Whether government does enough to reduce inequality at the dinner table has no uncontestably right answer. But the discussion’s starting point should be measures of consumption, or at least disposable income, measured after taxes and transfers, and ideally accounting for age. Not inequality in net worth.
Unfortunately, consumption inequality statistics are hard to come by.
The most thorough look at consumption inequality is now almost a decade old. It showed consumption inequality, as measured by the Gini coefficient, was about 30 – less than half of the current Gini measure of inequality in net worth.
And while the consumption inequality figure is old, it is on par with current Gini measures of inequality in equivalised household disposable income, which sits at 32.
Substantial injustices underlie some inequalities in net worth, at least in my contestable view.
Restoring housing affordability by making it easier to build would reduce the widening gap between housing’s haves and have-nots – an important form of inequality.
But Treasury also explains it would also have the perverse effect of increasing measured overall inequality in net worth.
So much the worse for inequality in net worth as standard for judging the world.
Who gets to have a dining room in the first place, and who does not, would be a better way of illustrating real and damaging inequalities than a misleading dinner game.